ChartMuseum Leaderboard
NeurIPS 2025
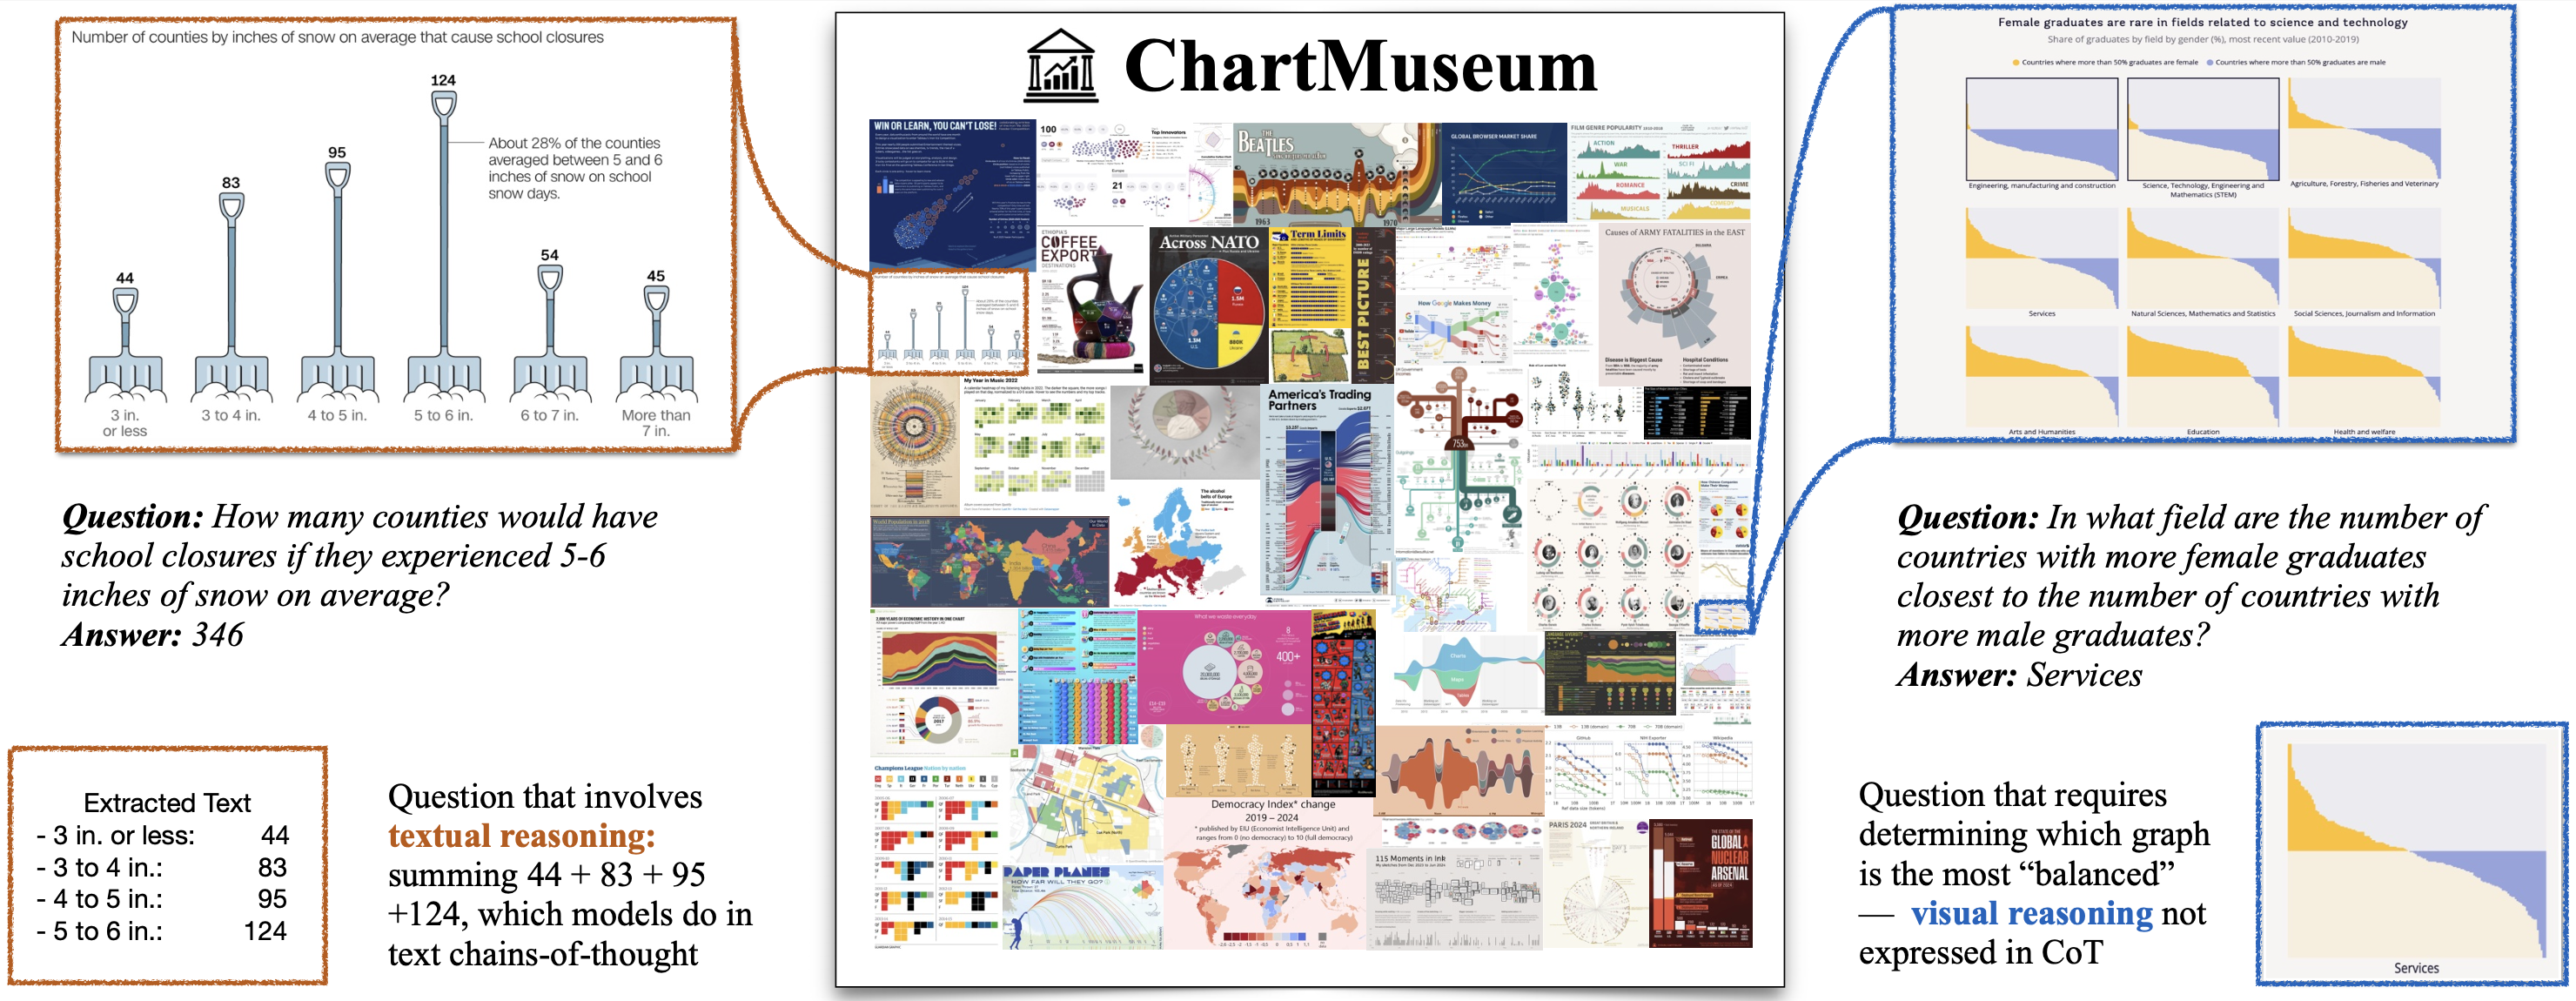
ChartMuseum is a chart question answering benchmark designed to evaluate reasoning capabilities of large vision-language models (LVLMs) over real-world chart images. We categorize the questions into four types:
- Textual reasoning questions can be solved almost exclusively with textual reasoning.
- Visual reasoning questions are most easily answerable from visual aspects of the chart.
- Text/Visual reasoning questions can be answered by either primarily text or primarily visual reasoning.
- Synthesis reasoning questions require both textual and visual reasoning.
Human overall accuracy on ChartMuseum is 93%, with 98.2% on the visual reasoning questions. Examples from ChartMuseum are available here.
Model Comparison
Compare model performance across different metrics.
18 / 36
selected / available models| Model | Size | Visual | Synthesis | Visual/Text | Text | Overall |
|---|---|---|---|---|---|---|
| GPT-5.2 (high) | - | 70.8 | 72.2 | 84.2 | 94.3 | 77.0 |
| GPT-5-mini (high) | - | 52.6 | 62.4 | 73.5 | 89.4 | 63.3 |
| Gemini-2.5-Pro | - | 53.3 | 64.7 | 70.1 | 87.8 | 63.0 |
| GPT-5 (high) | - | 53.7 | 64.7 | 68.4 | 88.6 | 62.9 |
| o4-mini (high) | - | 51.2 | 66.2 | 68.4 | 86.2 | 61.5 |
| o3 (high) | - | 50.4 | 63.2 | 69.7 | 85.4 | 60.9 |
| Claude-4.5-Opus (high) | - | 49.8 | 60.2 | 68.0 | 92.7 | 60.7 |
| Claude-4.1-Opus | - | 50.4 | 54.1 | 66.2 | 87.0 | 59.1 |
| Claude-4-Sonnet | - | 41.0 | 52.6 | 62.4 | 82.1 | 52.6 |
| Qwen3-VL-30B-A3B-Thinking | 30B | 38.8 | 47.4 | 57.7 | 82.1 | 49.7 |
| Qwen3-VL-8B-Thinking | 8B | 32.4 | 45.9 | 53.0 | 76.4 | 44.4 |
| GLM-4.5V | 108B | 32.7 | 33.8 | 47.4 | 67.5 | 40.6 |
| Qwen3-VL-30B-A3B-Instruct | 30B | 31.4 | 34.6 | 45.3 | 73.2 | 40.2 |
| Qwen3-VL-8B-Instruct | 8B | 27.8 | 41.4 | 50.0 | 70.0 | 40.0 |
| Qwen3-VL-4B-Instruct | 2B | 25.3 | 39.9 | 45.7 | 71.5 | 37.7 |
| Qwen3-VL-4B-Thinking | 4B | 26.1 | 34.6 | 43.2 | 65.9 | 36.1 |
| Qwen3-VL-2B-Thinking | 2B | 20.6 | 27.8 | 35.0 | 62.6 | 30.1 |
| Qwen3-VL-2B-Instruct | 2B | 17.7 | 18.8 | 27.8 | 38.2 | 22.7 |